Overcharged America: Solve the Digital Divide by Halting Billions in Cross-Subsidies
What Happened in Your State?

How much was overcharged and could be used to close the Digital Divide, or lower prices, or fiber-to-the-home?
SEE PART 1, SEE THE FULL REPORT or the details below.
In Just New York, in just 2019, Verizon:

- “Local Service” which are the basic, wireline, voice-only, copper-wired based business and residential phone service revenues was charged $1.2 billion in “Construction & Maintenance” and has historically actually spent only $75–$125 million.
- Local Service was charged $205 million, 54% of the total, for “Marketing”. When was the last time you saw an add for basic copper-based phone service?
- Local Service was charged over $1/2 billion in “Corporate Operations” expense, 61% of the total. In 2017, Local Service was charged $1.8 billion, 61% of the total for that year.
For just these 3 expense areas, Construction, Marketing, and Corporate Operations:
We estimate that Verizon NY Local Service was overcharged an estimated $1.1-$1.6 billion, in just 2019, in just New York (which includes NY City) and this includes overcharges created by the wireless cross-subsidies. (This is the low number.) Nationwide, this equates to Local Service being overcharged in America an estimated $16-$23 billion in just 2019.
The Verizon NY 2019 Annual Report was published on June 8th, 2020. Verizon NY is NY State’s (which includes NY City) primary public telecommunications utility, just like other state-based utilities, such as water, gas or electric.
This chart details the estimated overcharge of Verizon NY Local Service for just three specific expense areas; Construction & Maintenance, Corporate Operations expenses and Marketing, for just the year 2019.
This is PART II. PART 1 went through some of the basic components of this state-based telecom public utility, detailing how the accounting has been manipulated so that the majority of all expenses have been put into one category, Local Service.
Putting this in Context
Over the last decade, New Networks Institute and the IRREGULATORS uncovered a massive financial accounting shell game using the Verizon New York, state-based telecommunications public utility financial reports. It took us years to understand the multiple layers that are in place. In 2014, our report “It’s All Interconnected”, published by Public Utility Law Project, became the foundation for an investigation of Verizon New York, led by the Connect NY Coalition that resulted in a settlement in July 2018. Estimated at $300-$500 million, our research helped to get 30,000 lines of fiber optics to unserved areas and the maintaining of the copper networks that were deteriorating in areas the were never properly upgraded. But, this still left billions in cross-subsidies.
- On March 13th, 2020, our challenge of the FCC, IRREGULATORS v FCC, was a win for the American public. The DC Court of Appeals made it clear that the states are now independent to devise a new set of accounting requirements and not use the FCC’s formulas.
- On June 8th, 2020, The Verizon NY 2019 Annual Report was published.
- On June 8th, 2020, Verizon also filed a Motion with the NY Public Service Commission to hide, (they call it ‘redact’), basic financial and business data.
- On June 30th, 2020, the IRREGULATORS filed comments to block Verizon NY’s Motion and are now calling for investigations.
We summarized our filing and what was redacted and why it matters:
- Why are the IRREGULATORS Calling for Investigations? Halting cross-subsidies can supply the billions of dollars to close the Digital Divide
- What Is Verizon Afraid of? REDACTED XXX Opens Pandora’s Box. What was ‘redacted’ — and what we are asking for.
How Much Was Overcharged in Just New York, in Just 2019?
In order to fully determine how much money is owed to customers and how much has been cross-subsidized and needs to be halted and redirected so it can be used to build out the fiber to the home networks and solve Digital Divide, here is the starting point, based on the Verizon NY 2019 Annual Report.
IMPORTANT
- First, the underlying revenue and expense numbers presented were not created by the IRREGULATORS by are directly from actual financial reports from Verizon that were given to the NY Public Service Commission.
- Second, the numbers presented are NOT the total overcharging or the amount that could be recovered, but only recalculating the results of the Verizon NY Annual Report for 2019 and five years of annual reports.
- Third, this overcharging only covers 3 expense areas: Marketing, Construction and Maintenance, and Corporate Operations expenses. This means that excessive cell phone bills, customer overcharging for local service via cross-subsidies or a collection of miscellaneous charges, like not fully paying property taxes, are still on the table to be exposed.
- We apply the term “cross-subsidy” to mean that the wireline public telecom utility’s assets, infrastructure, construction budgets, etc. have been used by a different line of business without adequate payment or reimbursement. Moreover, these other lines of business or subsidiaries are not paying expenses that should have been allocated and paid for by these other entities. Worse, many of these items had a direct impact on customer rate increases and pricing, as well as public policy decisions such as who got upgraded and who didn’t, and with what technology and at what cost.
- IMPORTANT: Local Service is a line of business of Verizon NY; this is not direct overcharging of local phone customers, which is actually much higher. As we discussed elsewhere, local phone customers paid over $3,100.00 per line as of 2018 if they had the service since 2005.
If the expenses were reset to pay the actual expenses incurred, we estimate that Verizon NY 2019 Local Service was overcharged:
SEE THE OPENING CHART: We created a “low” and “medium” scenario. The “low” is based on historical models of expenses (or best guesstimates), while the “medium” is created based on the expenses being allocated using the % of the revenues (as was the case in 2001). The “paid” column represents the actual expense charged to that specific line of business. However, without full audits it is impossible to determine the full extent of the overcharging.
To Repeat:
- $1.1-$1.6 billion was overcharged to Local Service, in just 2019, using a limited number of factors. Again, we base the overcharging on Construction & Maintenance, Marketing and Corporate Operations expenses, only
- “Marketing” was charged $205 million, 54%, to Local Service. We estimate that the expense for the “low” scenario should have been less than $20 million, tops. When was the last time you saw an advertisement for basic copper phone service?
- “Construction & Maintenance” paid $1.2 billion. Historically, Local Service, based mostly on the existing, aging copper networks, had expenses of $75-$125 million. We used the high range of $125 million for the ‘low’ scenario. This represents a potential of $1 billion in overcharging as the construction appears to have been diverted to wireless.
- “Corporate Operations” was charged at 61%, over $½ billion dollars. We estimate that it should have been $200–300 million based on the historical record. In 2017, it paid $1.8 billion, which would be a $1.5 billion overcharge.
5 Year Analysis of Overcharging
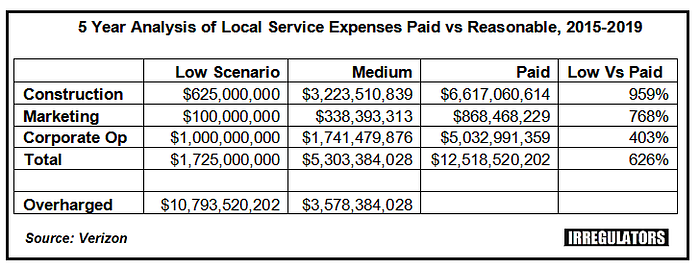
- Local Service, over the last 5 years, was charged over $12.5 billion in Construction and Maintenance, Marketing and Corporate Operations expenses.
- Using historical expenses, we estimate that it should have paid $1.7 billion; an overcharge of $10.8 billion.
- If Local Service paid the percentage of expenses based on the percentage of revenues, than Local Service (at 21%) was overcharged $3.6 billion.
- Local Service was charged almost $868 million dollars in just 5 years for MARKETING while the other lines of business, like FiOS video paid 15%.
- Local Service paid the majority of construction and maintenance which was double what ‘Backhaul’ paid.
Because of the FCC deformed accounting formulas, the pattern of cross-subsidy is evident and unchanged as the percentage that was applied year by year to each expense category for each line of business was unchanging.
Wireless Overcharge: If, as the research suggests, that 80% of the construction budget was improperly used for wireless, then Wireless construction from Local Service was $5.3 billion.
A Litany of Other Expenses and Overcharges
- These inflated expenses created losses for Local Service which were used as an excuse for rate increases since 2006.
- This lowered the tax payments as well as gave Verizon tax benefits.
- Rate increases were also granted for “massive deployment of fiber optics”, which were later diverted to fund the wireless networks instead.
- The other lines of business, like wireless, have been underpaying, and should be paying $750 million to $1 billion more, annually, for use of the networks as well as for the construction of their wireless networks.
- Some charges, like charging Local Service $868 million for “Marketing” over the last 5 years, when there is virtually no marketing for local phone service, is one of many areas that should be investigated.
The 2019 Annual Report Is Indicative of the Verizon New York’s Financials Over the Last 5 Years.
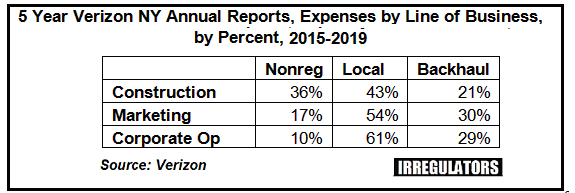
The next chart proves beyond a shadow of a doubt that the 2019 Annual Report is a continuation of the previous reports. This is a 5-year breakout of the expenses by line of business, as well as the percentage paid by each line of business on the right.

Now Multiply This by America.
The 2019 Annual Report Should Match All of the Other States: The FCC Accounting Financial Anomalies Are Nationwide.
We know that the last available data from the FCC for the other state utilities was from 2007, but we’ve obtained info on other states that shows that the FCC formulas are still in play; no state ever upturned these rules publicly and it appears the telcos never changed their accounting practices.
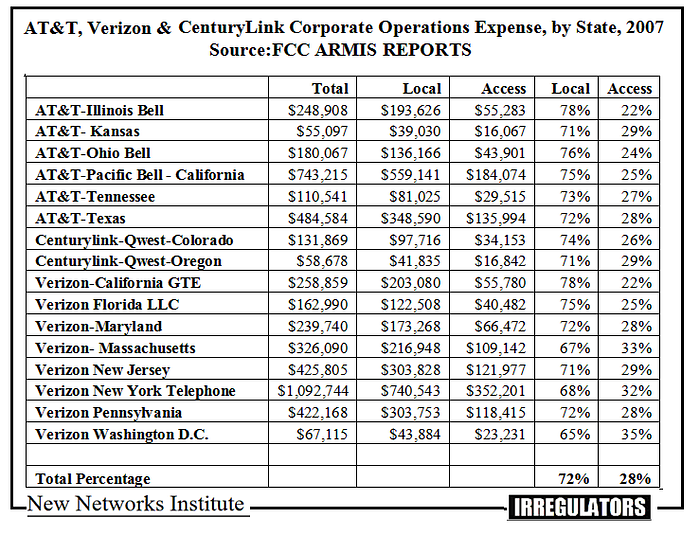
This chart supplies a collection of AT&T, Verizon and CenturyLink’s state utilities’ Corporate Operations expenses, using the Backhaul (here called “Access”) and Local Service lines of business. (In 2007, the Nonregulated category was nominal in revenues and thus expenses.) As you can see from the chart, while there is a range for the Corporate Operations expenses, the overall average was — Local Service was charged 72% of the total, while Backhaul only paid 28%.
We use this set of data as an indicator of the state-based overcharging coming up.
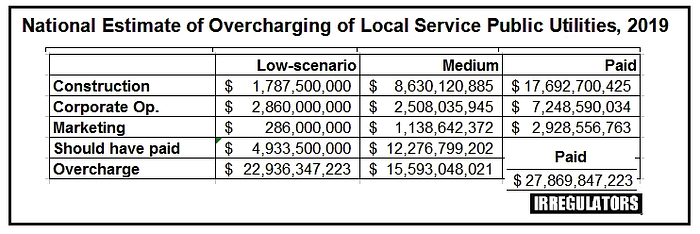
Nationwide Overcharging Estimates of Local Service in 2019
To create a model of nationwide overcharging, we used our New York analysis. More importantly, having tracked the state utilities for the last 2 decades, we know that New York historically represented 6–7% of the US wireline networks from time immemorial. We used 7% for this calculation.
Since the accounting formulas were the same and we can find no evidence that the rules are not in use, even when the state commissions or companies or advocates don’t realize this has been happening, we estimate that:
Nationwide:
- Local Service category has paid $28 billion in these 3 expense areas.
- Should have paid between $4.9 billion to $12.3 billion.
- Overcharged $15.6 to $22.9 billion dollars in just 2019.
Rough 5 Year Calculation:
- Local Service category has paid $140 billion in these 3 expense areas
- Should have paid between $24.5 billion to $61.5 billion
- Overcharged $78 to $114.5 billion dollars from 2015–2019
If this is even partially happening, the amount of money to close the Digital Divide is there and has been for the last decade, but the regulators never stopped to examine the cross-subsidies, much less stopped them.
11) Overcharging by State Utilities Controlled by AT&T, Verizon & CenturyLink.
We offer up the break out of various states utilities we have been covering for the last decade+. Using New York as the model as well as examining the expenses in each state for Construction, Corporate Operations and Marketing, we developed this chart. It does not cover most states nor would we consider it accurate until we had the actual state-based data and details.
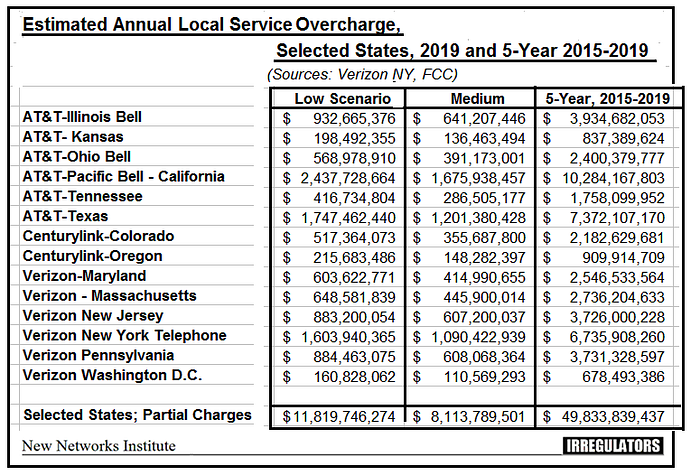
(For low and medium and paid definitions, see Verizon NY overcharging section)
- AT&T California has a range of $1.7 billion going to $2.4 billion in just 2019 for Local Service overcharging, and that comes to over $10.3 billion on average for 5 years.
- CenturyLink Colorado has $356 million to $517 million going to $2.1 billion for the last 5 years.
NOTE:) These overcharging calculations have many caveats, as it will require actual audits of the financial books in other states to determine the extent of the problem. But we have a set of 2 decades of financial reports from Verizon New York as well as our analysis. We also demonstrated that the other states matched NY using the last available FCC data, as well as FOIL requests and other state documents to realize this is a national problem.